Thursday, 30 April 2020

An Emotionless Migration Guide For AEM Infrastructure from AWS to Azure

Setting the Scene

Year 2018 saw a critical partnership between Adobe & Microsoft to unite data, content and process and with this came a strategic direction for Adobe Managed Services. Adobe Managed Services[1] had been offering platform based services and although the platform was considered completely cloud agnostic, a lot of automation was built around AWS and business scaled up supporting several hundreds of customers on AWS platform.

With the Adobe - Microsoft partnership, there was a clear direction for us to provide AEM Managed services platform on Azure. Systems were put in place immediately to bring on customers directly to AMS managed Azure systems. While this was a no-brainer, real value realization of partnership was to be seen when several key business moved from AWS hosting to Azure. With this came a clear business driver to start evaluating the various factors involved in lifting and shifting deployments from AWS to Azure.

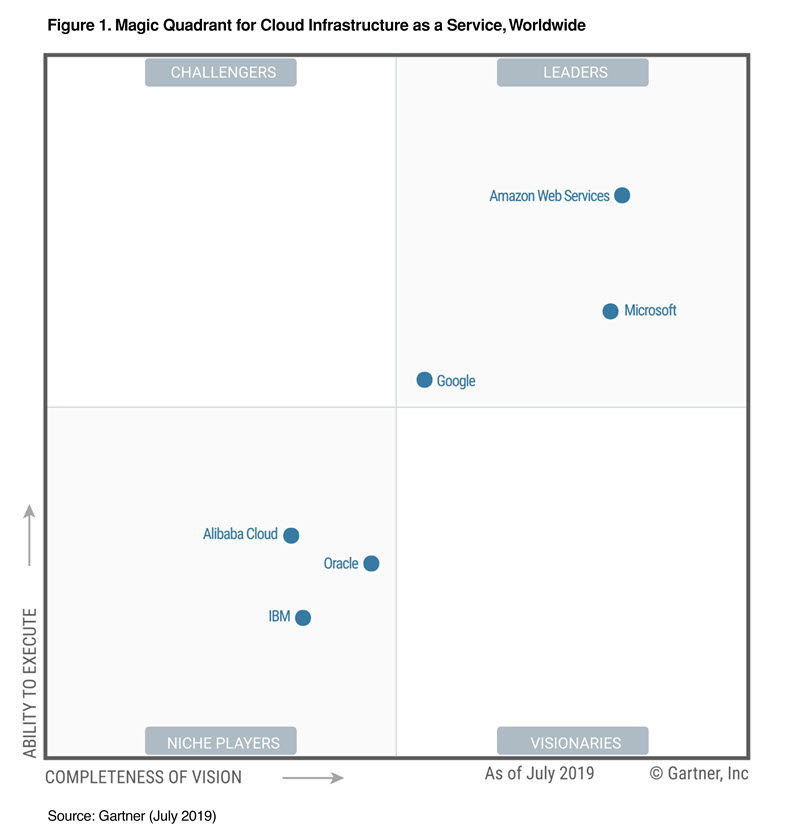
While Gartner sees Amazon far ahead leading the way, we also see Microsoft trending not too far behind. A detailed report [2] contains all the aspects that were considered while evaluating various players in this space.
AWS Named as a Leader in Gartner's Infrastructure as a Service ...

AEM Architecture on AWS 

A typical architecture on AWS involves a dedicated VPC (Virtual Private Cloud) with EC2 instances deployed in individual subnets


The deployment represented here is a typical AEM Sites deployment and when we bring in Assets and Forms into mix we would see the inclusion of S3 or JE servers in the mix with a similar type of architecture. The server configurations are entirely based on the availability and typically are Amazon's General purpose EC2 instances which offers a balance of network, compute and memory resources for a typical AEM workload. They are using fourth generation of custom nitro cards and ENA device to deliver 100Gbps of network throughput to a single instance.

The load balancer is either a classic elastic load balancer or customer tend to use the application load balancer along with basic web application firewall rules attached to it to provide minimum protection to layer 7 traffic at the infrastructure's end point.

The above example serves simply as a reference and by no means refers to an actual customer deployment and the scope of this article would be to use this as a reference and map out a similar architecture in Azure and strategy for movement .

Mapping of Components 
Al-Beruni et.al[3] has laid out a nice and easy to understand comparison of instance types between Azure and AWS. The DsV3 series of servers are designed for production workloads offering an ideal balance of compute, network throughput and memory in a similar comparison to the instance type of AWS.

Load Balancing: In comparison to Elastic Load balancer / Application load balancer, Azure AppGateway V2 provides similar capabilities including dynamic scaling, routing traffic at OSI Layer 7 and also similar protection with web application firewall with no additional cost. One of the main points of comparison is the number of sites that can be onboarded to ELB/ALB in comparison to AZGW. AWS ELB is first generation load balancer which does load balancing on OSI layer 4 and we can have only one domain mapping to the ELB while AWS ALB is based on OSI Layer 7, there is a hard limitation of hosting only 20 websites (HTTP&HTTPS) on a single ALB This certainly becomes a challenge with multi tenancy. Azure Gateway can host around 100 websites on the same instance.

One of the biggest draw back with AWS ELB is that customer can only have his WWW or Subdomain mapped to an ELB as they do not provide static IP associated with them. Only a DNS CNAME record can be added for ELB while ALB & Azure AppGateway provides a single static IP that can be added as a DNS A record for 100 different websites in the case of Azure AppGateway & 20 websites for ALB. This clearly is a blessing in disguise for customers who rely on multi-tenancy.

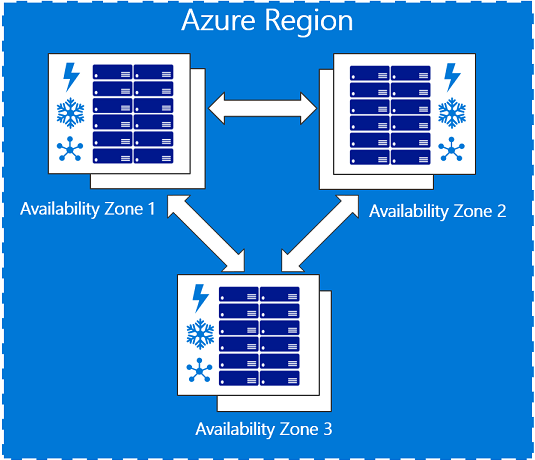
For a long time the concept of availability zones did not exist with Azure [4] and rather it was called update domain / fault domains, now these are integrated into availability zones. The whole requirement became crucial to provide high availability keeping in mind failures of datacenters. Azure also provides the capability of replicating data across the datacenters though keeping in mind AEM architecture, this may not be entirely relevant.

conceptual view of one zone going down in a region

CDN(Content Delivery Network) 
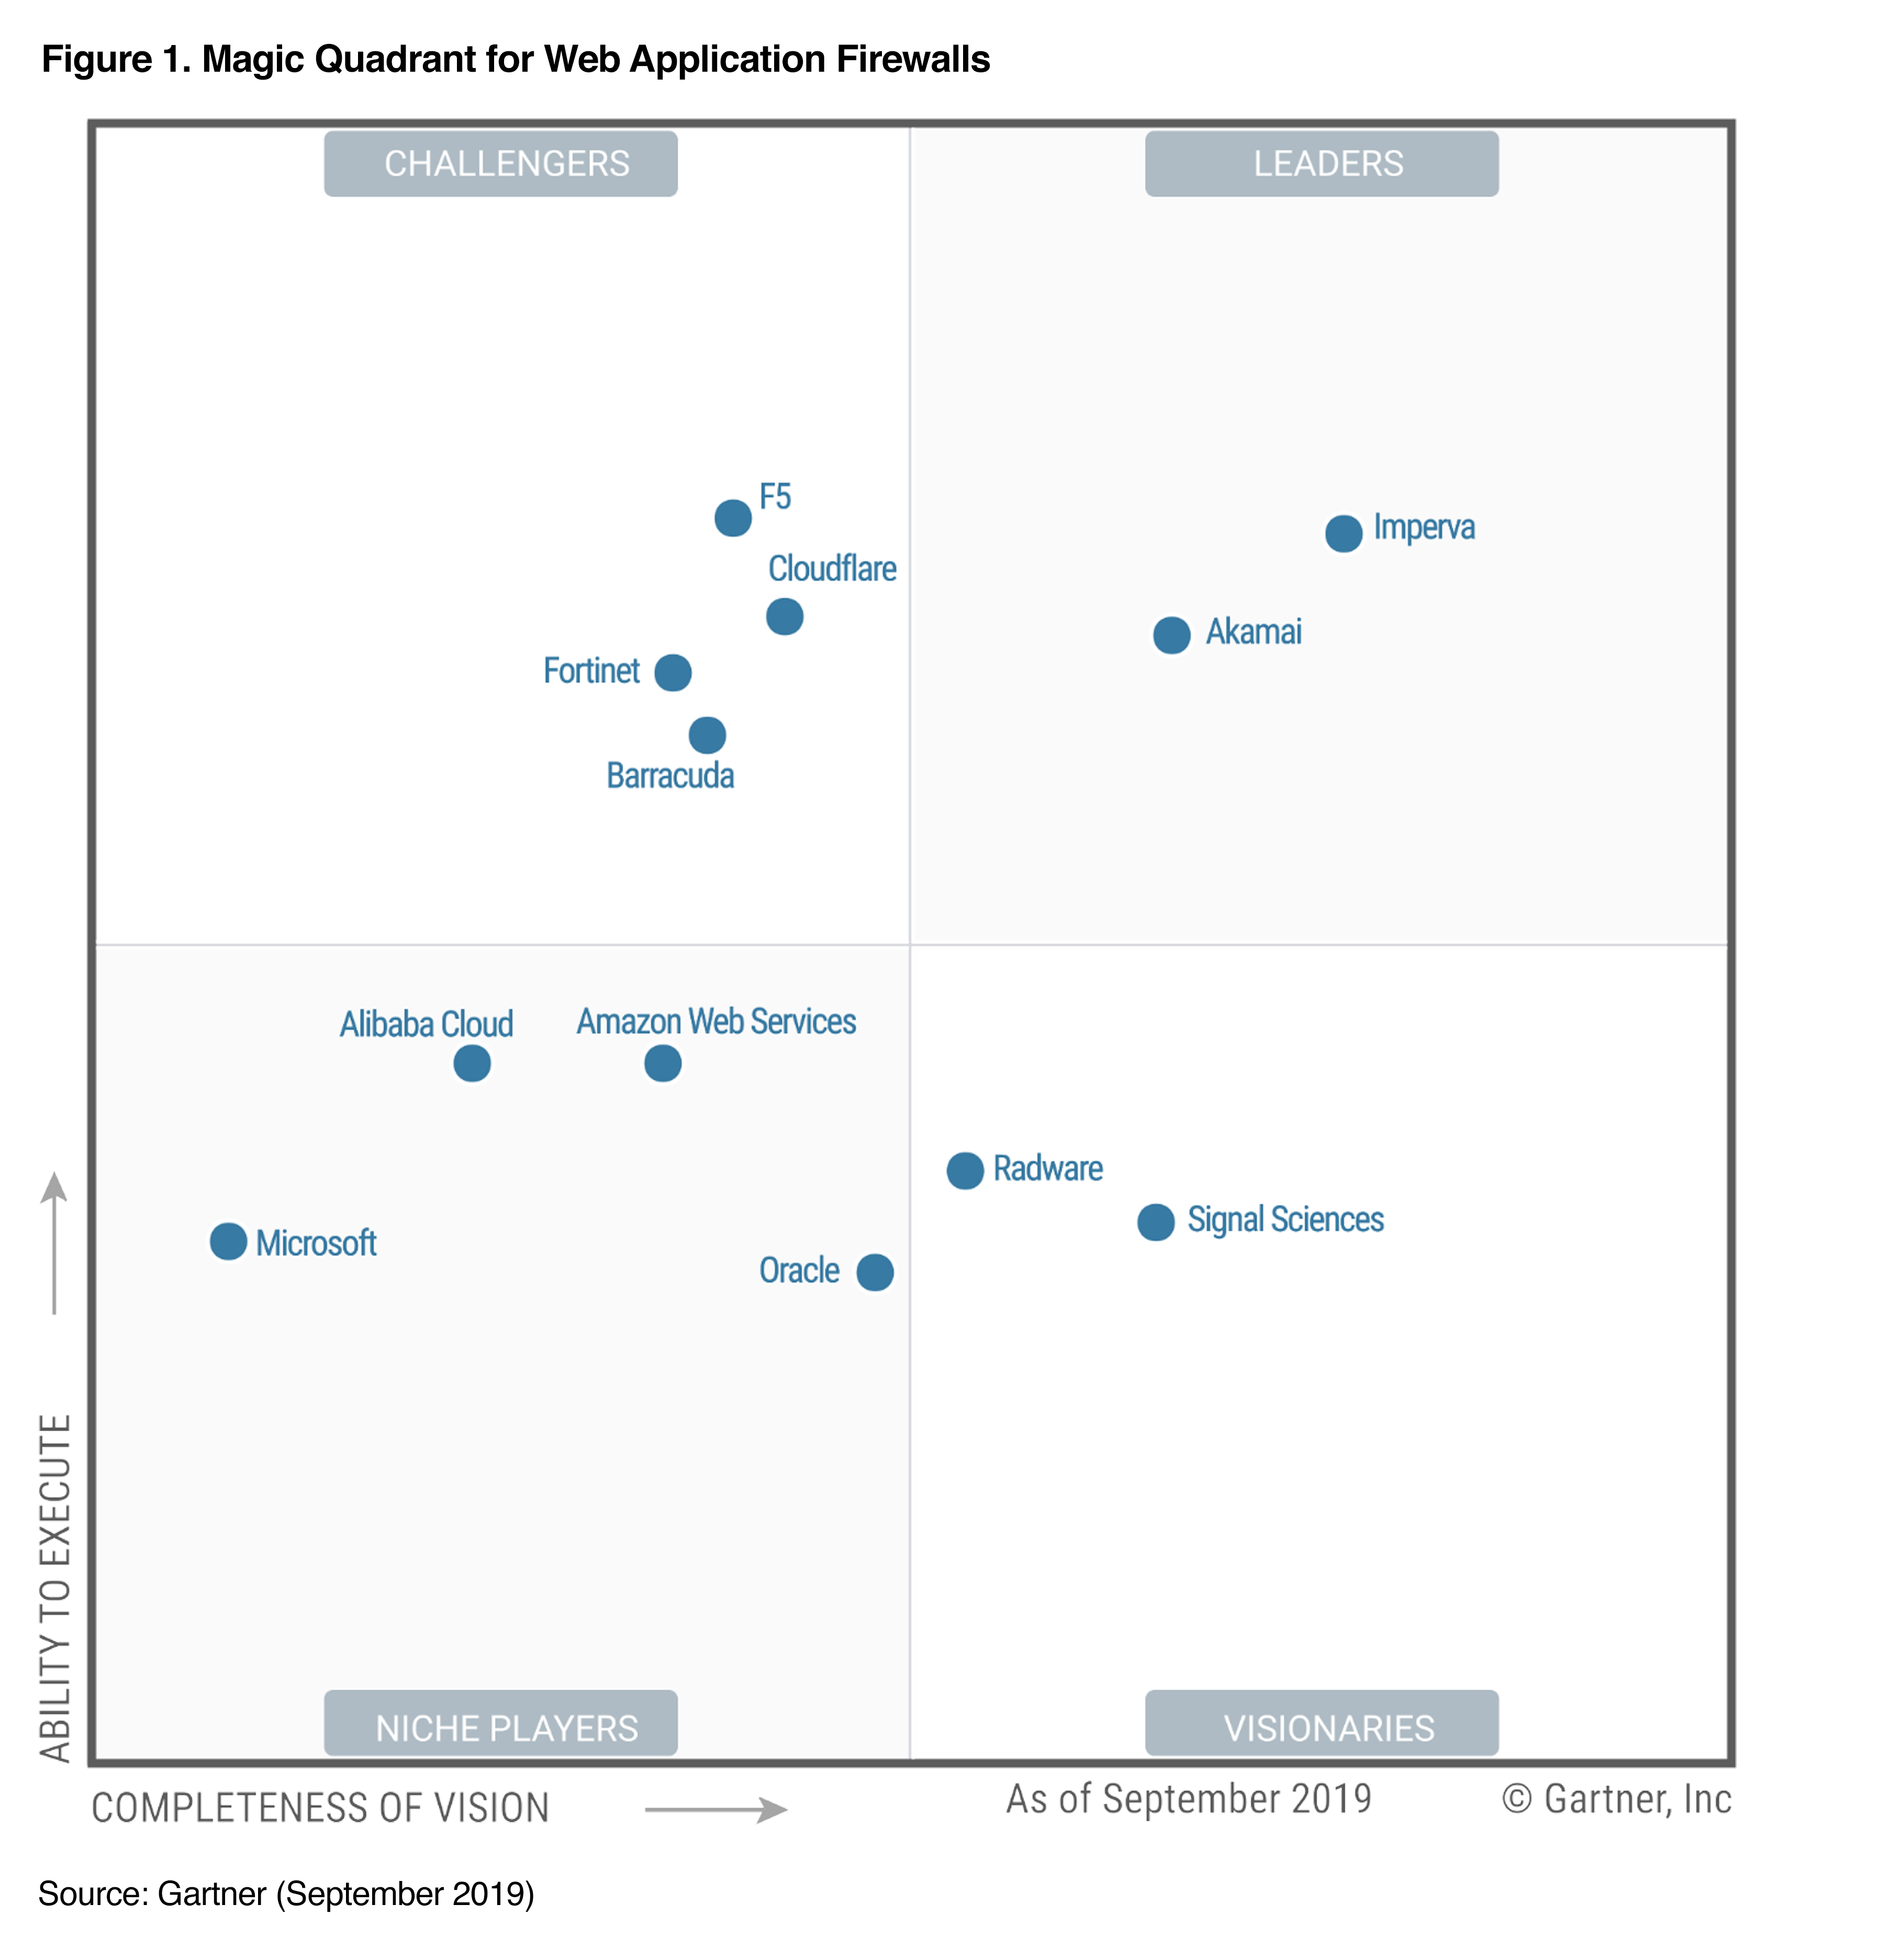
AWS Cloudfront[5]  is Amazon's native solution and has proven to be very robust and simple in terms of configuration while advanced features like GeoFiltering , native image compression, dynamic site acceleration etc. are missing amongst the feature set. Azure on the other hand has its own native Azure CDN and also has partnered with Verizon, Akamai to provide a range of solutions with a clean feature set comparison[6]. All of them provide basic web application firewall capabilities and Amazon provides even deeper capabilities with its Enhanced Security package which will be out of scope of this article. For general use cases, especially for simple websites, Cloudfront has proven to be fairly easy to implement and for complex solutions involving a lot of manipulations at the Web layer, Akamai has proven to be leader. Gartner Magic Quadrant in 2019 also calls out Akamai to be a leader in the CDN space.
Cloudflare Gartner WAF MQ 2019 | Cloudflare
Key Challenge(Data Migration) 
One of the key challenges would be to move data from AEM Servers in AWS to servers launched in Azure. There are several commercial solutions like Netapp's ONTAP [7] which become solutions to be considered if we are to move number of environments and large volumes of data from AWS to Azure.  Azure's Site Recovery is yet another Azure's native solution to achieve the same which relies on custom configuration for data movement directly accessing the public end point of Azure Stroage. Relying entirely on TCP/IP and utilizing no cost associated for the first thirty days , there will still be network costs associated with the migration.
In today's date, moving even 1TB of data is not considered large that would warrant to use services such as AWS snowball or Azure Databox, and hence approach of using Site Recovery or Azure Databox may be effective solutions without the anxiety of breaking network connections and losing data while tranfer, and with Azure Databox a workflow can also be scheduled for any delta data syncrhonization.

Summary
Objective of migrating from one cloud service provider to another in current context should be very straight forward as enterprises have started architecting solutions cloud agnostic and a number of instances the migration is typically seamless. This guide summarises the various considerations that would go in to migrate AEM from AWS to Azure.

Reference:

[1] https://helpx.adobe.com/in/legal/product-descriptions/adobe-experience-manager-managed-services.html
[2]  https://pages.awscloud.com/Gartner-Magic-Quadrant-for-Infrastructure-as-a-Service-Worldwide.html
 [3] https://araihan.wordpress.com/2018/08/02/amazon-ec2-and-azure-virtual-machine-instance-comparison/
[4] https://docs.microsoft.com/en-us/azure/availability-zones/az-overview
[5] https://aws.amazon.com/cloudfront/features/
[6] https://docs.microsoft.com/en-us/azure/cdn/cdn-features
[7] Netapp's ONTAP: https://cloud.netapp.com/blog/data-migration-from-aws-to-azure-reasons-and-challenges

Tuesday, 7 April 2020

AEM CloudManager Dispatcher Configurations - Mystery Solved! Softlinks in Windows & Managing Builds

Objective
One of the key challenges while automating deployments through cloudmanager is to manage dispatcher configurations especially since almost all of AEM deployments be it in Adobe Managed services deployment or AEM as a Cloud Native service. In both these type of platform hosting, deployment cease to be manual and has to be automated through AEM Cloudmanager.

While, the overall build process uses AEM Project Archetype[1] as a starting point, Adobe documentation does not entirely explain the process of including dispatcher as a module in the Multi-Module maven project. This article helps in bridging the gap between various documentations for customisers to easily integrate their dispatcher builds into their maven projects.


Modularisation of Dispatcher Configurations
As customers migrated to AEM 6.4 and above , Adobe managed services provided a modular dispatcher configuration as part of their standard build and customers adopted to the new structure similar to what we see below [2]. Customer has a freedom to modularize virtual hosts, dispatcher farm files for each and every property making it easier to manage the configurations and one configuration not affecting other properties. This also made managing the source configurations in repository and opened up the possibility of packaging the configurations as part of the overall build and deploy pipeline.

AMS Baseline includes start with a dispatcher_vhost.conf that will include any file with the *.vhost from the /etc/httpd/conf.d/enabled_vhosts/ directory.  Items in the /etc/httpd/conf.d/enabled_vhosts/ directory are symlinks to the actual configuration file that lives in /etc/httpd/conf.d/available_vhosts/
The New Challenge Imposed by Linux Based Soft links
With the onset of Dispatcher 2.0 configurations, the deployment process involved detailed documentation and steps involved for the Infrastructure implementation engineer a.k.a. customer success engineer to create soft links manually on the production dispatchers. While this approach is easy when the CSE has to deal with a couple of dispatchers, the complexity increases exponentially when there are multiple environments and each having multiple dispatchers.

 Apart from this as we migrate onto AEM as a Cloud Native service, the option of logging into the containers is totally ruled out as dispatchers are enabled for dynamic scaling along with the increase in Load.

This bring about a definite necessity to manage the dispatcher configurations through the build process as making manual changes by logging onto the dispatcher is completely ruled off in the containerised environments.

The challenge with the dispatcher build is that it involves creating Linux based soft links in GIT and committing the file to GIT. A number of developers who typically work in windows based environment have faced the challenge while developers working in MAC or Linux based systems have found it extremely easy to handle this challenge.

Creating Softlinks in MAC: 
Softlinks have to be relative to directory where the softlink is created. For example, in the below example:

The soft links are created in /etc/httpd/conf.d/enabled_vhosts but relative to enabled_vhosts directory. The steps would be as below:

1. cd $GIT_HOME/dispatcher/src/conf.d/enabled_vhosts
2. ln -s ../available_vhosts/wonderwall_publish_prod.vhost wonderwall_publish_prod.vhost


Please note: The soft link is created relative to the current working directory (enabled_vhosts).

Creating Softlinks in Windows

If the developer is used to using GIT BASH on Windows, softlinks has to be enabled while installing GIT Bash
1LKsG.png

Once Symbolic links is enabled, navigate to the GIT source directory and create a symbolic / soft link similar to the approach followed in MAC (Please note: The soft link is created relative to the current working directory)

Symbolic Links cannot be created using "Source Tree"

** Incase you have previously installed GIT Bash Use the below command **
  1. run GIT Bash as Administrator

  2. Copy & paste this command in GIT Bash export MSYS=winsymlinks:nativestrict


Creating Symbolic Links in Windows 10

1. Windows user must enable developers mode on his desktop (Settings > Update & Security > For Developers and select “Developer mode”) 
2. use the mklink command to create symbolic link. Detailed instructions are provided in Microsoft blog[3] 


The Final battle: Getting the Build compiled and generating a Dispatcher Package
Maven Assembly Plugin

Maven Assembly plugin[4]  helps in building non-standard builds especially generating a ZIP file with all symbolic links intact 

A simple extract from [5] shows the structure of the assembly plugin needed for Dispatcher build: 


<assembly xmlns="http://maven.apache.org/ASSEMBLY/2.0.0"
    xmlns:xsi="http://www.w3.org/2001/XMLSchema-instance"
    xsi:schemaLocation="http://maven.apache.org/ASSEMBLY/2.0.0 http://maven.apache.org/xsd/assembly-2.0.0.xsd">
  <id>distribution</id>
  <formats>
    <format>zip</format>
  </formats>
  <includeBaseDirectory>false</includeBaseDirectory>
  <fileSets>
    <fileSet>
      <directory>${basedir}/src</directory>
      <includes>
        <include>**/*</include>
      </includes>
      <outputDirectory></outputDirectory>
    </fileSet>
  </fileSets>
</assembly>
Final Notes: 

Once a build is successfully generated , please get your infrastructure implementation engineer to run a controlled deployment with your dispatcher package and ensure configuration checks pass successfully and apache restarts successfully. If the controlled deployment is successful , please get it embedded in the build process. 


Reference:
[1] https://docs.adobe.com/content/help/en/experience-manager-core-components/using/developing/archetype/overview.html
[2] https://helpx.adobe.com/experience-manager/kb/ams-dispatcher-manual/explanation-config-files.html
[3] https://blogs.windows.com/windowsdeveloper/2016/12/02/symlinks-windows-10/
[4] http://maven.apache.org/plugins/maven-assembly-plugin/
[5]https://docs.adobe.com/content/help/en/experience-manager-cloud-manager/using/getting-started/dispatcher-configurations.html


Wednesday, 5 October 2016

Adobe Experience Manager 6.0 –A Study on Performance, Scalability and Capacity Guide

Adobe Experience Manager 6.0 –A Study on Performance, Scalability and Capacity Guide

Vijay Krishnamurthy*, Gadigappagouda Patil*, Prasenjit Dutta*, Shahul Shaik*, Ranju Vaidya+, Sruthisagar Kasturirangan*
* Infrastructure SCG &+ Content Management SCG-CQ

Abstract

                The recent launch of Adobe Experience Manager 6.0 has grabbed the attention of community of ardent technologist because of the massive re-architecture effort that has gone in designing the product which surfaces as the leader in content management systems. This also brings about lot of eagerness to solution architects to understand the performance profile of product in order to effectively utilize in multiple design scenarios.
                A concerted effort has been put in to thoroughly study the performance profile of AEM 6.0 and here with we present a capacity planning guide that will help community of solution architects and infrastructure architects to design effective digital marketing platforms.

1.0 Introduction


SapientNitro in the last few years has been actively engaged in redefining how stories can be told across the brand, digital and commerce. In doing so SapientNitro has enabled digital marketing platform to maximize the capabilities of Adobe Experience Manager which is an enterprise-grade web content management system in building a completely unified digital marketing platform. A digital marketing platform brings on capabilities for launching dynamic digital campaigns supporting features like social collaboration.  

It becomes highly important for us to completely understand performance profiles of the web-content management system under various scenarios. Just as Sheldon Monterio1 notes, user behavior has drastically changed and technology backed marketing agencies have to become extremely creative in not only increasing the number of page views but encouraging active participation in collaborative manner.

With a clear intention of studying the performance, a thorough study was made on the user behavior of various digital marketing platforms that were launched successfully by SapientNitro and all the test cases were designed surrounding a realistic user behavior. We also carefully considered Adobe­­ published Capacity Guide2 for designing our test cases and performed scenario based executions.

Through these tests, we are now able to provide a general guidance on the methodology needed in order to size the Adobe Experience Manager infrastructure and identify key bottlenecks that need to be kept in mind as part of the overall design of a content and collaboration platform.

This paper has been written not to contend the results provided by Adobe Systems Incorporated in their documentation but to extend the results for virtualized environments due to the influx of development in the arena of cloud hosting. The following results have been elaborately analyzed and discussed before arriving at the conclusions you’re about to read.

2.0 Experimental Setup

First, let’s briefly go through the experimental setup we used to conduct those benchmark tests, including the AEM version used, the system configuration, the benchmark architecture, and the test scenario.

AEM Version

AEM 6.0

System Configuration

Author & Publish Environments (Virtual):
Virtual CPU ‘s: 8
Memory Size: 8192MB
Total Paging Space: 4096MB

Red Hat Enterprise Linux Server release 6.3 (Santiago)
Linux Kernel 2.6.32-279.el6.x86_64
JVM Settings: Maximum Heap Size: 4GB; PermGen: 512MB; Java HotSpot 64-Bit 1.7.0_45
JVM Options: -Djava.io.tmpdir=/app/tmp -Dcom.day.crx.persistence.tar.IndexMergeDelay=0 -XX:+HeapDumpOnOutOfMemoryError -Xloggc:/app/author_aem6/crx-quickstart/logs/gc.log -XX:-UseConcMarkSweepGC -XX:NewSize=2G 
 Physical Server** (Underlying Physical Server):                HP Proliant DL 380 G7
Processor: Intel Xeon X5675
Processor Core Available: 6
Processor Speed: 3067 MHz
Number of Processors: 2
Memory: 32GB(4 * 8GB DIMM/DDR3)
HDD: HP 146GB 6G SAS 15K rpm
Virtualization: Xen Server 6.2

Benchmark Architecture

Test Scenario

The tests below were all performed using Adobe’s out-of-the-box application Geometrixx. A transaction mix with a combination of loading static pages, search queries and few social collaboration operations such as posting a question and rating an article were carried out. We also performed highly scoped tests limiting the transaction mix to pure static content and social collaboration operations.

Work Load Model


The work load models considered are as follows
Mixed Scenario Work Load Model
SNo
Functional Area
Perf (Y/N)
% of mix
Pages / Day
Pages /Hr
Pages/ Sec
Pages/Iteration
loops/hr
Threads 0r Users
Average RT / Page in sec
Thinktime /Call in sec
1
HTML Pages
Y
40%
57600
7200
2.00
8
900
12
2
4
2
Search Scenario
Y
15%
21600
2700
0.75
2
1350
5
2
4
3
Post Question Scenario
Y
20%
28800
3600
1.00
8
450
6
2
4
4
Rating Scenario
Y
15%
21600
2700
0.75
8
338
5
2
4
5
Checkout Scenario
Y
10%
14400
1800
0.50
9
200
3
2
4
6
Total

100%
144000
18000
5.00
35
3238
30


Baseline Load
20%

Average Load
50%

Average Think time /Page
4 Second


SoCo Scenario Work Load Model
SNo
Functional Area
Perf (Y/N)
% of mix
Pages / Day
Pages /Hr
Pages/ Sec
Pages/Iteration
loops/hr
Threads 0r Users
Average RT / Page in sec
Thinktime /Call in sec
1
Post Question Scenario

Y
75%
108000
13500
3.75
8
1688
11
2
1
2
Rating Scenario

Y
25%
36000
4500
1.25
2
2250
4
2
1
3
Total

100%
144000
18000
5.00
10
3938
15


Baseline Load
20%

Average Load
50%

Average Think time /Page
1 Second


Static Pages Work Load Model
SNo
Functional Area
Perf (Y/N)
% of mix
Pages / Day
Pages /Hr
Pages/ Sec
Pages/Iteration
loops/hr
Threads 0r Users
Average RT / Page in sec
Thinktime /Call in sec
1
HTML Pages

Y
75%
108000
13500
3.75
8
1688
17
2
4
2
Searh Scenario
Y
25%
36000
4500
1.25
2
2250
5
2
4

Total

100%
144000
18000
5.00
10
3938
22


Baseline Load
20%

Average Load
50%

Average Think time /Page
4 Second


Definition of Terms
Think Time
User waiting time between page hits.
Percentage of Mix
In the above Work load model, distribution of work load across various functional areas.
Functional Area
Type of functionality being tested
Pages Per Day
Estimated number of page views calculated based on users, response times and think time. 
Pages Per Iteration
Number of pages views tested per functional area
Loops Per Hour
Number of pages per hour / Number of pages per iteration.
Average RT
Target average response time
Baseline load
An assumed percentage of load(20%) of the peak load scenario for testing system stability.
Average Load
Testing application behavior under estimated average load of the application. Assumption is 50% of the peak load.


3.0 AEM 6


In the following section, a brief description of the underlying system architecture of AEM has been described which has changed with AEM 6.
 

Figure 1: Microkernel Repository (Source: Adobe)

Notable among the change is the move from CRX( based on JackRabbit 2.0) to Oak (JackRabbit 3.0) . Oak uses a MVCC concurrency model and allows for scalable read and write operations. 5,6,7
This brings about a new challenge of testing the performance of underlying micro-kernels namely TAR microkernel and MongoDB microkernel.

4.0 Test Iterations


Two different kinds of executions were performed namely peak load test and stress load test. The purpose of the stress load test was to completely exhaust the resources on the system by incrementally increasing the number of concurrent users. Although the stress load tests would not necessarily indicate an acceptable response time still the factor of this test was to ensure the stability of the system. The goal while running peak load test is to check the application stability while keeping the response times within acceptable service level agreements and measuring the system performance.

The various iterations of testing are listed below and the details of the load model and results are described in the following sections. In particular, the result sections are focused on analyzing the transactions per second as a function of the total number of transactions and 90th percentile response times (i.e., time taken for last byte).


Iteration 1: Peak Load Test with TAR MicroKernel – Static Page Work Load Model

Iteration 2: Peak Load Test with MongoDB – Static Page Work Load Model

Iteration 3: Peak Load Test with TAR Micro Kernel – Mixed Scenarios Work Load Model
Iteration 4: Peak Load Test with MongoDB Micro Kernel – Mixed Scenario Work Load Model

Iteration 5: Peak Load Test with TAR Micro Kernel – Social Collaboration Work Load Model
Iteration 6: Peak Load Test with MongoDB Kernel – Social Collaboration Work Load Model

Iteration 7: Comparison Run – Load Test With AEM 5.6.1

5.0 Result Analysis

                Different iteration tests were performed in order to closely study the behavior of AEM in different scenarios. Adobe Experience Manager although provides huge flexibility on what it can be leveraged for, it is recommended to be used in scenarios where we are dealing with static sites and assets.
                Three types of scenarios were focused namely mixed scenario work load model, a static & search work load model and a social collaboration work load model. As the name suggests in the mixed work load model, we combined static page views, searches, social collaboration and a small mix of transactions to mimic a realistic user transaction.  The systems performance indicated very poor scalability. We were able to hardly ramp up to only 7 concurrent users achieving about less than 1 page view per second. Table 1 in Appendix indicates the real bottleneck in terms of response time during this execution was sing-in and sign-out pages for transactions related to social collaboration.

A natural question arises that since social collaboration scenarios proved out to be the bottle neck would there be an improvement in performance by using a different micro kernel configuration i.e. MongoDB instead of TAR micro kernel.  A test performed using MongoDB micro kernel proved out that there was further degradation in performance and even in this scenario the social collaboration transactions proved out to be the primary bottleneck.


From the above analysis, it was observed that social collaboration was a bottle neck but in order to analyze what part of social collaboration was a bottleneck there were iterations of test conducted specifically to determine the performance profile for social collaboration. Overall we could observe that we were already getting bad response times as we scaled up to 15 concurrent users and hardly achieving less than 2 transactions per second.  In the Table 2 in Appendix, it is observed that even accessing a static page, “POST_Support_Page” which essentially is a page after signing in produces extremely bad response times because it is loading all the existing comments from the repository. This essentially does indicate that even large reads from repository seems to be creating severe bottle neck.

The most important aspect of scalability study is what AEM is designed for, a complete study of the static rendition of content. The results that were observed with AEM 6.0 were extremely encouraging compared to the previous releases of AEM namely 5.6.1 and 5.5. Graph 1 in appendix indicates the transactions per second that was achieved during the peak load test. With TAR Micro Kernel we could achieve about 12.1 TPS within acceptable response times.
When this is compared to the AEM Version 5.6.1, it indicates an improvement of more than two times. In AEM 5.6.1 we were able to achieve 4.6 page views per second for a test that was conducted under the same conditions, test scenarios and benchmark environment setup.

A similar test was performed for static page work load model with Mongo DB micro kernel and it was observed that we were able to achieve 5.1 page views per second within acceptable response times. Graph 2 in appendix shows a plot of transactions per second versus elapsed time during the test.


In order to summarize the above discussed results, Table 3 in Appendix gives the consolidated results of all the above mentioned iterations in an easily understandable format.

6.0 Capacity Planning


                The benchmarking of AEM 6.0 also gives us clear indication on the underlying performance of the micro kernels, which also provides us an approach to give an approach for performing capacity planning. Capacity planning although scientific would involve a number of attributes that play a significant role which makes us take an engineering approach of considering several approximations and assumptions. These assumptions have to be solidly backed up with observed phenomenon.
                Adobe Systems Incorporated® gives a formula based approach3 to perform capacity planning. This formula deals in giving approximate numbers for application complexity, template complexity, caching ratio  and based on the concurrent page views provides a methodology to arrive at the number of AEM publish instance required to size the infrastructure.
                Alternatively, we understood that although we can give approximations for the above mentioned factors, it will be more realistic to benchmark AEM publish instance against the default application that comes out of the box post installation. This methodology helps us to benchmark the AEM publish instance more thoroughly and also gives a clear picture to the application development team on comparing their own application with the out of the box application in terms of application and template complexity and eventually arrive at a factor of the benchmarked capacity for their own application. In worst case scenario, the out of the box application of AEM is extremely light weight and arriving at a capacity based on the out of the box application gives much more confidence while performing capacity planning for an entirely new application.
                Based on the above notes, the number of AEM Publish instances can be calculated by the following formula:


Where:

                Total Pages views per second:- Data based on Analytics of existing size or expected traffic to the new digital platform.
                cacheRatio:- The percentage of pages that come out of the dispatcher cache. Use 1 if all pages come from the cache, or 0 if every page is computed by CQ.
                Benchmarked Publish Capacity:- Total Transactions per second achieved during benchmarking as discussed above in results section of this paper.


Conclusion

                The result and discussion section details about the various scenarios and the throughput achieved through benchmarking AEM Publish under various work load scenarios. We have also given a simplistic approach to perform capacity planning based on the above results.


References

1.       Predicting Desirability – Lessons from a Teen Genius – Sheldon Monterio, Insights 2013 – By Sapient Nitro’s Idea Engineers http://www.sapient.com/assets/imagedownloader/1477/insights2013full.pdf
2.       CQ Planning and Capacity Guide
3.       CQ Hardware Sizing Guidelines
4.       Introduction to Adobe’s Social Communities
5.       Oak Framework


Appendix

Table 1: Response Time For Mixed Work Load Scenario

Table 2: Response Time For SoCo Work Load Scenario


Table 3: Result Consolidation – All Iterations

Iteration Number
Iteration Type
Achieved Transactions Per Second(TPS)
Number of Users
90th Percentile Response Time(Seconds)(Averaged across all transactions)
1
TAR Micro Kernel – Static Page Work Load Model
12.5
65
2.5
2
MongoDB Micro Kernel – Static Page Work Load Model
5.4
26
2.26
3
TAR Micro Kernel – Mixed Scenarios Work Load Model
< 1(0.78)
7
4.6
4
MongoDB Micro Kernel – Mixed Scenario Work Load Model
< 1(0.6)
5
9.4
5
TAR Micro Kernel – Social Collaboration Work Load Model
< 1(0.686)
6
4.06
6
MongoDB Kernel – Social Collaboration Work Load Model
< 1 (0.7)
15
41.73
7
Comparison Run – Load Test With AEM 5.6.1 – Static Page Work Load Model
4.6
27
0.61

Graph 1: Static Page Work Load Model : TAR MK:  Transaction per second Vs Elapsed time


Graph 2: Static Page Work Load Model :MongDB MK :  Transaction per second Vs Elapsed time


About the Authors
Vijay Krishnamurthy,Manager Infrastructure @ SapientNitro
Gadigappagouda Patil, Infrastructure Engineer@ SapientNitro
Prasenjit Dutta, Lead Performance Engineer @SapientNitro 
Shahul Shaik, Lead Performance Engineer @SapientNitro 
Ranju Vaidya, Director Technology @ Razorfish
Sruthisagar Kasturirangan, Senior Manager Infrastructure @ SapientNitro